← Go back
Sections
The following Evaluative Research Mini Course is an expansion of the content presented in our step-by-step guide.
This mini course explores some more advanced topics that would more typically be addressed in a research project.
The course is covered in 5 major sections. You may proceed in the order presented below, or jump ahead to the section of your choice.
You may proceed in the order presented below, or jump ahead to the section of your choice.
What is “Art for Social Change”?
Regardless of the art form or tool used, art for social change engages the members of an identified community using creative imagination and expression to work out identity, shared values and aspirations. It is hoped that participation in this kind of creative engagement would lower the threshold for many forms of social participation and social action, and would help people to find new ways to see and be engaged in the world.
What makes this “Social Change”?
While there is great potential for individual learning and development in this work, art for social change is community-focused, aimed at groups rather than just individuals. Issues affecting individuals are always considered in relation to group awareness and group interests. Building skills for social change requires meaningful participation in shaping collaboratively created work.
(Reference: Goldbard, A. (2006). New creative community. The art of cultural development. Oakland, California: New Village Press)
ASC
Photo by Stephanie Sicore, distributed under a CC BY 2.0 license.
Types of Art For Social Change Projects
There are 3 major types of art for social change projects:
  1. Artist creation: the artist(s) create their own artwork, and the social change content is in the work itself (e.g., Pablo Picasso’s Guernica)
  2. Group problem solving: the artist(s) act as facilitators using art as part of a problem solving process, where group art creation is not the final goal of the project (e.g., image theatre to improve corporate teamwork)
  3. Group artwork creation: the artist(s) act as facilitators for group art creation for social good (e.g., see the Examples page)
This guide assumes that your project being evaluated is going to fall into the category of “group artwork creation.” It's important to clarify that art for social change projects are not focused solely on the production of art, but on the process of making art together, for example to work out identity, shared values, and aspirations.
ASC Types
Photos by Isengart, Medialab Prado, Jumblies Theatre distributed under a CC BY 2.0 license.
Art Forms
In addition to considering the project outcomes, it is helpful to consider the art form(s) being used in the project as this may also influence the monitoring and evaluation method(s) that you select.
Below are some of the art forms that may be involved in an art for social change projects. This is not an exhaustive list; an art for social change project could utilize combinations of these art forms, or others not listed here.
  • Performing arts
    • music
    • dance
    • theatre
    • circus
    • interactive performance
    • spoken word
    • oral storytelling
  • Multimedia
    • digital storytelling
    • art installation
  • Visual arts
    • drawing
    • painting
    • sculpting
    • murals
    • graffiti
    • urban arts
  • Media arts
    • photography
    • video
  • Literature
    • poetry
    • creative writing
Art Forms
Photos by Phil Roeder, Frank Kovalchek, Mike Goren, Fredrik Rubensson, distributed under a CC BY 2.0 license.
Evaluation of Art For Social Change Projects
There has been growing interest in better understanding and documenting whether and how community-based arts initiatives can bring about social change. However, for some artists and community groups involved in art for social change projects, the topic of evaluation can be fraught with frustration.
This resource seeks to better inform those involved in art for social change projects regarding the diverse theories, methods and techniques that may be useful for evaluating such projects.
You will need to address questions like:
  • What is the theory behind the program?
    (What does the program hope to accomplish, and how?)
  • Who is the evaluation for?
    (The internal staff? The community? The funder? All of the above?)
  • What is the purpose of the evaluation?
    (Improve the program? Decide whether funding will be renewed? Other?)
Artist Evaluation
Whose perspective?
There are different groups that may be involved in the project:
  • Artists
  • Program participants
  • Facilitators
  • Researchers
  • Funders
  • Community groups
  • Social activists
These groups may all have different objectives. As such, the perspective from which an evaluation is being conducted is important to consider and articulate.
Groups
Quantitative Evaluation
Quantitative data are data that can be measured and assigned a numerical value. For example: average age of participants of each gender, number of participants enrolled, and so on.
In art for social change projects, you can collect primary data, which is data you collect for the purpose of your evaluation. For example, quantitative evaluation can be based on comparing the number of people who answer one way versus another in a survey.
Or, the quantitative data can be secondary data, which is data taken from already existing sources. For example, secondary data could be crime rates, school drop out rates, or substance abuse rates. These numbers can be used in analyzing outcomes.
Graphs
Qualitative Evaluation
Qualitative data are data that can be observed or experienced, but not directly measured. For example: colours, textures, smells, tastes, phrases, expressions, statements and stories.
In art for social change projects, qualitative evaluation is based on what people say or otherwise express. The data can be used to gain insight and understanding of certain phenomena.
Crayons
Photo by Pink Sherbet Photography, distributed under a CC BY 2.0 license.
Quantitative and Qualitative
While studies can be quantitative or qualitative, keep in mind that projects may collect both types of data.
Also, a quantitative study could have an open-ended question on a survey that would collect some interesting qualitative data.
Likewise, information collected from a qualitative study may also include some information summarized into a quantitative format; for example, the proportion of the people interviewed that mentioned a certain topic.
Mixed Methods
Mixed Methods
A mixed methods approach involves integrating methodologies, traditionally quantitative and qualitative, but arts-based methods can also be integrated with quantitative and qualitative.
The benefit of mixing methods is that it can help you overcome the limitations and weaknesses that arise when each method is used alone and allow you to ask a broader set of questions. If different data sources reveal the same findings, or findings that are coherent with each other, this can lend credibility to your evaluation. A mixed method evaluation can also deepen understanding of your program, its effects, and context.
Examples
Visit the Examples page to see examples of projects using mixed methods approaches.
Mixed Methods
Some Issues to Consider in Mixed Methods Evaluations
  • What stage(s) of the evaluation to mix methods? (The design is considered much stronger if mixed methods are integrated into several or all stages of the evaluation.)
  • Will methods be used:
    • sequentially (the data from one source inform the collection of data from another source), or
    • concurrently (triangulation is used to compare information from different independent sources)?
  • Will qualitative and quantitative methods will be given relatively equal weighting?
Mixed Methods
Arts-Based Evaluation
Arts-based evaluation (ABE) utilizes art or artistic processes in the evaluation process itself.
It is important to distinguish between ABE methods and the evaluation of arts-based projects. ABE methods can be used for ASC projects, but are not necessarily always the best methods to use. ABE methods conversely, can be very effective in gathering data on projects that have little to do with art or social change. While both ASC projects and ABE methods utilize art, ABE methods are evaluation tools. As such, the arts-based evaluation methods should be planned for and prepared in advance of implementing the project, as with other evaluation methods.
ABE methods do not necessarily have a social change component. For example, adolescents attending a course on financial accounting may be asked to draw a picture or write a poem to indicate how they felt about the course; this would be an example of ABE, but the intervention had nothing to do with social change.
Generally, when ABE is used for ASC projects, the activity can both itself be “the ASC” activity, serving as an intervention to achieve a desired outcome. At the same time, this exercise can have great evaluative or research value that also sheds light on the effectiveness of the ASC intervention at achieving its desired goals, including the challenges faced.
One commonly used art-based technique that can be seen both as an “arts-based intervention to promote social change”, as well as an “arts-based evaluation” technique is photovoice. In photovoice, participants are asked to photograph images that represent the research subject and/or how they feel about an intervention underway. The photographs can be interpreted to derive themes and narratives for further research. Some may reflect directly on what a community-based project means to them. For example, persons living with a disability could be asked to photograph what is meaningful to them - some participants may photograph the barriers they face on a daily basis; others show various accommodations implemented. The photos are analyzed to identify common barriers as well as to reflect on how participants feel about measures offered.
Indeed when art forms are used in evaluation, by allowing participants to express themselves creatively, this exercise itself can be seen as “arts for social change”.
Examples
Visit the Examples page to see examples of projects using arts-based evaluation methods.
See an example of a photovoice exercise as well as an example of an embodied inquiry/performative inquiry workshop - as used in our arts-for-social change research.
ABE
Arts-Based Evaluation
Arts-based evaluation (ABE) utilizes art or artistic processes in the evaluation process itself.
It is important to distinguish between ABE methods and the evaluation of arts-based projects. ABE methods can be used for ASC projects, but are not necessarily always the best methods to use. ABE methods conversely, can be very effective in gathering data on projects that have little to do with art or social change. While both ASC projects and ABE methods utilize art, ABE methods are evaluation tools. As such, the arts-based evaluation methods should be planned for and prepared in advance of implementing the project, as with other evaluation methods.
ABE methods do not necessarily have a social change component. For example, adolescents attending a course on financial accounting may be asked to draw a picture or write a poem to indicate how they felt about the course; this would be an example of ABE, but the intervention had nothing to do with social change.
One commonly-used ABE method is photovoice. In photovoice, participants are asked to photograph images that represent the research subject, and then the photographs can be interpreted to derive themes and narratives. For examples, persons living with a disability are asked to photograph the barriers that they face on a daily basis. Then the photos are analyzed to identify common barriers.
Arts-based approaches may be used in combination and/or in conjunction with more traditional approaches.
ABR
Social Context
Social context is fundamental to understanding the adequacy of program conceptualiza­tion and design:
do interventions adequately address the social context within which target outcome are created, sustained and socially dis­tributed in time and space?
Social context is also fundamental to program implementation:
are interventions optimized to take advantage of the unique conflu­ence of opportunities available in each local context?
Finally, social context shapes the production and utilization of evaluation findings:
the influence of key assumptions and stakeholders on the design and implementation of the evaluation.
Social Context
Advantages of Art-Based Evaluation/Research
Advantages of arts-based methods include:
  • Participants have the opportunity to express themselves through different art forms which may reveal insights that they may not have otherwise been articulated
  • May be more conducive to exploring and communicating subjective experiences that can be difficult to capture with traditional methods
  • The arts can accommodate people who learn in different ways, people who have different cultural backgrounds and/or who are less articulate
  • The arts can accommodate skills and abilities of vulnerable populations
  • Encourage participation of those who may otherwise be reluctant
  • Increase participant engagement and empowerment in producing arts-based work
  • Address, challenge and rebalance traditional power dynamics
  • Utilizes alternative ways to produce and communicate research findings, which are often more accessible to diverse audiences
  • The arts may be better suited to capture complexity and multidimensionality that is otherwise difficult to capture comprehensively with traditional methods
Clay
Challenges of Art-Based Evaluation/Research
Challenges of arts-based methods include:
  • Some participants may be reluctant to engage with arts-based techniques
  • Arts-based data may be more time consuming and/or resource intensive to collect (e.g., planning a performance, preparing an exhibit)
  • Resources and costs required to produce art (e.g., cameras, art supplies, theatre space)
  • Arts-based data may be more difficult to analyze and interpret
  • May provoke painful or unexpected feelings for the participants and/or evaluators/researchers
  • May be limited to small sample size and subsequent impact on generalizability
  • Ethical issues regarding privacy and intellectual property surrounding group artwork creation
  • Challenge to define, measure and collect longitudinal outcomes
  • Difficulty in establishing validity in the case of multiple interpretations
Examples
Visit the Examples page to see examples of projects using arts-based evaluation methods.
Reference
Boydell, K.M., Gladstone, B.M., Volpe, T., Allemang, B. and Stasiulis, E. (2012). The production and dissemination of knowledge: A scoping review of arts-based health research. Forum Qualitative Sozialforchung/Forum: Qualitative Social Research. 13(1), Art. 32.
Paint brushes
Funder-driven and/or Self-driven
It is always useful for an organization to review what they are hoping to accomplish and how they are doing. Unfortunately, evaluation is sometimes associated with “funder’s imposition”, with an expectation of well-defined quantitative data showing the “value” of the program, rather than a more thoughtful critically reflective process.
Funder
We'd like to see the numbers. What percent improvement do you have for the indicators you are evaluating?
Artist
Who is initiating the evaluation?
Depending on who requests or initiates the evaluation – whether it is the funder, you as the project organizer, the participants and/or the community – there can be different intentions for undergoing an evaluation. For instance, funder-driven evaluations are often associated with an expectation of well-defined quantitative data showing the “value” of the program to demonstrate a return on investment. On the other hand, a self-driven evaluation may focus more on qualitative data, such as examining the experience of the participants.
If the evaluation is funder-driven, it can be helpful to discuss with the funder the evaluation process and how the results will be used. Keep in mind that research does not always have to be quantitative; it may be preferable to use qualitative or arts-based methods, or even a combination of quantitative and qualitative methods.
Funder
We'd like to see the numbers. What percent improvement do you have for the indicators you are evaluating?
While we can provide some numbers, we'd also like to examine the experience of the participants.
Artist
Collective Impact & Shared Measurement
The social challenges and problems we face today are often at the intersection of many systems, contextual factors and the relations between them- in other words, the social processes involved.
It is hoped that when those who have been marginalized from social, cultural and economic access artistically create together, social inclusion and their sense of worth and sense of community will improve, thereby increasing social equity and improving collective living conditions (Spiegel & Parent, 2017). However, actual collective impacts are linked to how individuals engage with larger social and collective activities and conditions (Spiegel & Parent, 2017).
Social determination of health:
The analysis we adopt in the tool, as explained by Spiegel et al, 2018, is the notion of “social determination of health” whereby health is conceptualized as:
“a complex multidimensional dialectic deeply rooted in social and political processes in which social groups have “ways of living” defined by their position in class/gender/ethno-cultural relations, in turn expressed in individual lifestyles and bio-psychological embodiments (Breilh, 2010, 2013; Krieger, 2011). The social determination of health approach, in contrast to the more traditional social determinants of health analytic framing, focuses attention not merely on the discrete factors or conditions that impact health and wellbeing (e.g. nutrition, housing, education, income, etc.), but rather on the structural processes at the societal level that lead to these social inequities, and the interrelationships among these (Breilh, 2008).”
The overall objective in trying to better understand “collective impact” of an arts for social change project thus should focus on:
“understanding the complex ways by which social policies, as well as their associated social interventions employing the arts (sociocultural interventions), intercede in the dominant modes of constructing ways of being and lifestyles at the individual and collective level.” (Spiegel et al., 2018)
References & Resources:
Breilh, J. (2008). Latin american critical ('social') epidemiology: New settings for an old dream. International Journal of Epidemiology, 37(4), 745-750.
Breilh, J. (2010). Las tres "s" de la determinación de la vida y el triángulo de la política. 10 tesis hacia una visión crítica de la determinación social de la vida y la salud. En: Passos R, organizador. Determinacao social da saúde e reforma sanitaria. Rio de Janeiro: CEBES, 88, 94.
Breilh, J. (2013). La determinación social de la salud como herramienta de transformación hacia una nueva salud pública (salud colectiva)/The social health determination as a tool of transformation towards a new public health (community health). Revista De La Facultad Nacional De Salud Pública, 31, 13-27.
Krieger, N. (2011). Epidemiology and the people's health: Theory and context. New York: Oxford University Press.
Spiegel, J., and Parent, S. (2017). Re-Approaching Community Development through the Arts: A ‘Critical Mixed Methods’ Study of Social Circus in Quebec. Community Development Journal.
Spiegel JB, Ortiz B, Campaña A, Boydell KM, Breilh J, Yassi A. (2018, under review). Social transformation, collective health and community-based arts: Buen Vivir and Ecuador’s social circus program. Global Public Health.
Measuring collective impact:
In their article on collective impact, Kania and Kramer (2011) focus on the collective benefits within the partnership of those involved (rather than society as a whole, which would be too big a task for an “evaluation” exercise.). Kania and Kramer focus on shared measurement, which goes hand-in-hand with authentic partnerships.
As with other types of evaluation, it is important to consider the theory of social change underlying the program as this will inform the focus of the evaluation. In shared measurement, this is especially important to establish among the collective impact partners, as the partners may otherwise approach social change at different levels – for example, at the micro (individual) level versus the meso (group) level – and this would influence the respective choice of measures or indicators to collect and analyze within the shared measurement system.
One example of a method relevant for collective impact and its shared measurement is outcome mapping. In outcome mapping, the focus shifts from measuring direct causal outcomes to focus on behavioural changes and the subsequent ripple effect as those changes move into the wider community and into other domains. This is particularly relevant for collective impact, where the overall goals of social change may be too complex and longstanding to attribute as direct causal outcomes to individual programs. Learn more about outcome mapping in the e-book, Outcome Mapping: Building Learning and Reflection into Development Programs, published by the International Development Research Centre.
References & Resources:
Cabaj, M. (2014). Evaluating Collective Impact: Five Simple Rules. The Philanthropist, 26 (1).
Earl, S., Carden, F., & Smutylo, T. (2001). Outcome Mapping: Building Learning and Reflection into Development Programs. International Development Research Centre.
FSG & Aspen Institute Forum for Community Solutions. (2014). Collective Impact Forum.
Kania, J., & Kramer, M. (2011). Collective impact. Stanford Social Innovation Review, 9(1), 36-41.
Kramer, M., Parkhurst, M., & Vaidyanathan, L. (2009). Breakthroughs in Shared Measurement and Social Impact. FSG Social Impact Advisors.
Patton, M. Q. (2008). Utilization-Focused Evaluation (4th ed.). Thousand Oaks: Sage Publications.
Guiding Principles
Evaluating community-based social change initiatives often entails working within inequities, such as those caused by systemic discrimination and unequal distribution of power. In working within inequities, a set of principles may be helpful to guide ethical and equitable work in this area. The Canadian Coalition for Global Health Research (CCGHR) developed “Principles for Global Health Research,” which can be applied to other areas of research and evaluation beyond global health research. The principles are:
  • Authentic Partnering
  • Inclusion
  • Shared Benefits
  • Commitment to the Future
  • Responsiveness to Causes of Inequities
  • Humility
Read more about the principles on the CCGHR website.
Funder-driven and/or Self-driven
However, traditional evaluation methods are not always appropriate for art for social change projects. These reasons may relate to:
  • inappropriateness or difficulties in defining quantifiable outcome; and/or
  • small sample size; and/or
  • complexity of defining the target population; and/or
  • the nature of the program itself.
Funder
While we can provide some numbers, we'd also like to examine the experience of the participants.
Artist
From Evaluation to Research
There is a continuum from “operational process evaluations to show funders how funds have been spent” to “inquiry for more in-depth understanding of the social impact of an art for social change (ASC) project that contributes new knowledge to the field of ASC”. Some authorities consider only the former to be “evaluation” and the latter to be “research” best conducted by academic scholars. It may be wise to see this as a continuum rather than a dichotomy (either one or the other).
Research vs. Evaluation
If the intention is to publish in a peer-reviewed journal, this would be to the right of the continuum and would require research ethics approval (a requirement for publishing in a peer-reviewed academic journal). Alternatively, if the evaluation is being conducted for the organization's own internal use and not intended for a broader audience, this would be to the left of the continuum.
Regardless of the position along the continuum, it is important to conduct the research/evaluation ethically and systematically so it can be used and interpreted by other people.
Terminology
The words “evaluator” and “researcher” are used interchangeably in this tool, for simplicity.
Similarly, the words “data” and “information” are used interchangeably; both mean the results of quantitative, qualitative and/or arts-based evaluation or research.
Hiring an evaluator
We designed this tool so any organization can conduct evaluation in-house. However, if your funding allows it, you may want to hire an evaluator. It is important to consider this early in the planning stages, as an evaluator will likely have valuable input.
Keep in mind that the evaluator your group selects will have an impact on the type of evaluation they conduct. It's important to select someone who shares your vision.
You'll want to consider previous experience in:
  • The art
  • The community
  • Conducting evaluations or research
It may also be the case that you want to conduct the evaluation without an external evaluator. This could be beneficial as nobody will know your program better than your own team.
Hiring an Evaluator
How do you see your art for social change project evaluation?
Microscope
Rigorously document the material facts about this ASC project
Marching
Reveal how the ASC project can empower people to effectively mobilize for social change
Mind
Reveal the multiple realities to challenge dominant discourses about ASC projects such as this one
Heart
Understand what participants experience in this ASC project
Overall, it’s vital to consider the context of the project.
What does the project hope to accomplish?
The answer to this question will determine what are suitable method(s) to use for your evaluation. For instance, a particular outcome may be best evaluated with quantitative methods whereas a different outcome may be better suited to a qualitative evaluation, or even an arts-based approach.
Below are a few of very many examples of desired outcomes from art for social change projects.
  • Improve school readiness
  • Enhance the quality of life of people living with a disease
  • Build relationships across intercultural, intergenerational, and other differences in life experiences
  • Include people with developmental disabilities in a university environment
  • Empower social change within educational institutions
  • Reduce reoffending rates in incarcerated youths
Examples
The list above provides only a few examples. Visit the Examples page to see more examples of ASC project outcomes.
Outcomes
Logic Model
Note that “evaluation” should never be an afterthought. Projects and programs should try to plan their activities with as clear as possible idea of the outputs, outcomes and impact they wish to have — and how each of these will be assessed. This is referred to as a “Logic Model”.
Examples of Evaluations or Evaluative Research*
We have compiled a searchable list of examples. In addition to filtering by outcome, you can filter the list by:
  • Type of evaluation (arts-based, quantitative, qualitative)
  • Art forms used in the evaluation
  • Population that the program targets
  • Issue that the program studied
  • Country that the program took place in
* As these examples were mainly drawn from peer-reviewed academic journals, most of these examples fall more on the side of evaluative research than program evaluations. In other words, the authors were likely funded as researchers not only to evaluate the specific program, but to contribute new knowledge to the body of scholarship on the impact of ASC project.
Please do not feel that these kind of in-depth undertakings are necessarily needed for routine ASC evaluations.
Who should you engage with during the evaluation?
It's important to involve your partners throughout the evaluation process.
Across the field, ASC practitioners emphasize the value of long-term partnerships and projects both as crucial to deepening impact and as an ethical imperative in community-engaged work. As an integral part of this community-engaged work, partners should be actively involved in the evaluation process, including involvement in:
  • Defining the project outcome(s) of interest
  • Planning the evaluation
  • Selecting the method(s)
  • Interpreting the observations
  • Sharing the results
Throughout the project and evaluation process, key success factors in developing partnerships include:
  • Relationship development
  • Trust
  • In-depth planning time
The way in which partners are involved in the evaluation process may depend on the governance and/or operational models of the project. There are various ways to organize and structure partnerships, both at the governance and day-to-day operational levels.
Governance models of partnership include:
  • Joint: partners collaborate with equal ownership and accountability; often involves shared funding and/or resources.
  • Stratified: one partner assumes primary ownership while supporting the other partner(s).
Operational models of partnerships include:
  • Co-location: use of shared studio and office spaces to avoid rising property costs, as well as opportunities for networking and the creation of new relationships and partnerships
  • Integration of activities: institutions such as libraries and parks boards are integrating ASC activities into their own programs and facilities.
Evaluating Partnerships
Navigating partnerships effectively can be complex and challenging, so ongoing monitoring and evaluation of the partnership itself can be beneficial to help ensure alignment and mutual benefit among partners.
The Canadian Coalition for Global Health Research (CCGHR) offers a Partnership Assessment Tool to guide and support the joint evaluation of health research partnerships, although it can be applied to other sectors including art for social change evaluations. The tool consists of a series of questions and exercises, leading through four stages:
  1. Inception
  2. Implementation
  3. Dissemination
  4. “Good endings and new beginnings”
Download the Partnership Assessment Tool from the CCGHR website.
Partnerships
End of Part 1: The Basics of ASC
Take a quiz, proceed to the next section, or go back to the main menu:
End of Part 1: Ethics
Take a quiz, proceed to the next section, or go back to the main menu:
End of Part 3: Methods
Take a quiz, proceed to the next section, or go back to the main menu:
End of Part 4: Techniques
Take a quiz, proceed to the next section, or go back to the main menu:
End of Part 5: Analysis
Take a quiz, proceed to the next section, or go back to the main menu:
End of Part 6: Dissemination
Take a quiz, proceed to the next section, or go back to the main menu:
End of Mini-Course
Congratulations! You have completed our mini-course on evaluative research. Hopefully this has aided in providing some valuable information about some of the more complex issues and concepts involved in doing a more nuanced research project.
Quantitative Evaluation
Quantitative evaluation is outcome-oriented. You will need to have predefined outcomes for your project. You will then test to see how your program is doing with respect to these outcomes using numerical data.
For example, you may want to design an evaluation that tests to see if participation in your program promotes self-esteem. You could do so by analyzing participants’ responses on a validated questionnaire.
It would be wise to try to compare before (“pre”) with after (“post”) some time during the program. One option is to use a single questionnaire that asks participants to detail their experience from the program (“pre”), and then to reflect back and detail their experience before the program began (“post”); this is called a retrospective post-pre survey.
It is even better to compare these changes in your program participants with changes in a similar group that didn't participate in the ASC project. For more information on comparison groups, see the Evaluative Research Mini-Course.
Graphs
When To Use Quantitative Evaluation
Quantitative evaluations are useful for an ASC project that aims to impact a specific, predefined outcome. For example, change in use of alcohol or drugs, improvement in school grades or completion, or even constructs such as self-esteem or social inclusion.
The project should also have a large enough group of participants to have the statistical power to be able to detect a meaningful change related to the program if indeed it did occur. There are several factors which influence the calculations for sample size and statistical power. Online sample size calculators can help you quickly calculate the sample size needed based on the population size, confidence level, and margin of error.
Large Group Of People
When Not To Use Quantitative Evaluation
This type of evaluation works less well when an ASC project prefers to:
  • not predefine outcomes; and/or
  • be more interested in documenting the intrinsic value of the art-making rather than the evaluator’s concept of relevant indicators of success; and/or
  • be more interested in understanding why a certain program seems to have the effect the organizers believe it has, rather than determining if there is indeed a measurable effect on something the evaluator thinks is important; and/or
  • have small target groups that are not numerous enough to show statistically significant changes in specific indicators; and/or
  • be designed such that it would be hard to gather complete or close to complete data from all the participants, which could result in biased results.
Small Group
Photo from Jumblies Theatre, used with permission
Primary or Secondary Data
The data for analysis can be information gathered specifically for this study, also called primary data. This is usually done with surveys.
An analysis can also be cone on data already available. This is called secondary data.
For example, an ASC project concerned with whether engaging in community-based arts increases grades for at-risk youth can look at youth transcripts (with informed consent), or decreased school drop out rates in the community as a whole. This would be secondary data.
An ASC project concerned with whether engaging in community-based arts decreases the crime rate for young offenders could look at criminal records. This would also be secondary data.
Primary Data
Cross Sectional vs. Longitudinal Evaluations
A cross sectional evaluation will gather data from a single point in time.
A longitudinal evaluation will gather data more than once, to observe how certain variables change over time. Typically a longitudinal evaluation will take place over a long period of time, often many months or even years.
However, a longitudinal study could take place over a short period of time. For instance, a survey could be taken at the start of a weekend workshop, and then retaken at the end of the weekend to observe any changes. However, with such a short time frame, it’s unlikely that you would see much change from your initial observations on any indicators that really matter for social change.
Note that a retrospective post-pre evaluation can also be done. This is when you ask people to answer various questions according to how they feel now, as well as a comparison question according to how they remember feeling about this question when they started the program.
Seasons
Comparison Group
If you are going to conduct a longitudinal evaluation, it could be beneficial to have a comparison group. That is, an extra group will participate in the pre-post survey, but will not participate in the art intervention. This can make for what is considered to be a stronger study; it can show the changes occurring over time between the two groups.
Keep in mind that the comparison group needs to be similar to the group that is receiving the art intervention. This may not always be feasible. If participants self-select into their own groups, you may find that each group is very different to begin with.
Comparison Group
Project Length: Cross-sectional
Study Length 1
A cross-sectional analysis, whether qualitative or quantitative, takes place at a single point in time. For example, doing a single survey of program participants after a group art project.
Project Length: Comparative Cross-sectional
Study Length 2
A comparative cross-sectional analysis also occurs at a single point in time. However, it is more comprehensive than a descriptive analysis of just one program, and will consider the viewpoints or experience of those in both the community that is, as well as one that is not, in the ASC project.
Project Length: Longitudinal
Study Length 3
A longitudinal analysis will evaluate the same group of people over a period of time, and will monitor how their views and opinions change over this time.
If possible, it is valuable to conduct a follow up evaluation in the medium- or long-term after the program ends. For example, you could conduct a follow up evaluation with the participants one year after the program finishes to assess the longer term effects of the program for the participants. While it can be challenging to complete such longitudinal evaluation (e.g., based on limited funding terms, challenges with maintaining contact with participants, etc.), it can be particularly beneficial for arts for social change projects, as social change is inherently on a longer-term scale.
Project Length: Longitudinal with comparison group
Study Length 4
If it is possible to also consider a comparison group, you can determine if any changes in your main group are also occuring in the community outside of your ASC project.
Project Length: Summary
Study Length 5
The type of evaluation that your project will adopt largely depends on the length of your ASC project and the resources available to you.
Qualitative Evaluation
Qualitative evaluations seek to explore issues, contexts, interactions, experiences, processes and reasons for outcomes. Qualitative evaluations are better suited for ASC projects that seek to explore the experience of participants, rather than have predefined outcomes.
The value of qualitative research lies in understanding rather than measuring differences.
These approaches tend to view the world not as one truth, but believe in multiple realities and in socially constructed meanings.
Qualitative
Ethnography
Ethnographic approaches seek to understand the social world of a specific culture being studied through immersion in the community to produce detailed descriptions of the culture and beliefs.
Ethnography is guided by the assumption a specific culture guides members to view the world and guide their experiences in a specific way, and the researcher aims to learn from the members of the cultural group.
In the context of ASC evaluation, ethnography investigates the experience of a specific group (for example, street-youth) engaged in an ASC activity.
The techniques used to obtain this information include in-depth interviews, review of records or charts, observations and other types of evidence, and may also include arts-based methods.
Ethnography
Types of Ethnographic Evaluation
Performance ethnography uses performance to generate data for the ethnographic study.
Auto ethnography uses the self to generate data for the ethnographic study.
Video ethnography uses videos to generate data for the ethnographic study.
Performance
Photo from Jumblies Theatre, used with permission
When to Use an Ethnographic Approach
Ethnographic approaches require extensive involvement of the researcher in the field and thus are better suited for ASC evaluations in which the researchers can spend significant time with participants. This approach is less well suited for evaluations of short intensive interventions.
 
Phenomenology
Understanding participants’ “lived experience”, and the concepts or ideas people use in everyday life to make sense of their world.
Works to uncover meanings contained within conversation or text.
In the ASC context, the researcher tries to understand emotions, attitudes, thoughts, perceptions, and bodily experiences of participants as or after they engaged in an ASC intervention.
Data gathering techniques include in-depth conversations, in which the phenomenologist helps the participants describe their lived experiences without leading the discussion. Often, two or more conversations are needed with a small number of participants (10 or less).
Phenomenology
When to Use a Phenomenological Approach
This approach is well-suited for evaluating the lived experience of a small number of participants involved in an ASC project. Because this approach requires lengthy involvement with each participant, it is less well suited for assessing ASC interventions that include a high number of participants.
When to use phenomenology
Photo by Guillaume, distributed under a CC BY 2.0 license.
Grounded Theory
In this approach, the researcher generates a situation-specific, emergent theory of social action based on the data gathered. In the context of ASC, a researcher could use grounded theory to develop a theory to explain how participation in a particular ASC intervention promotes social engagement.
Data gathering techniques include interviews, focus groups, and document analysis, but can also include arts-based techniques.
Grounded Theory
When to Use Grounded Theory
You can use grounded theory when you want to develop a theory that offers an explanation on how your ASC project creates social change. However, this research method is labour intensive and requires some data analysis skills, so is less well suited for projects that require a quick evaluation.
 
Case Studies
In-depth and detailed examination of one particular case, person, or organization. The context within which the case is embedded is also taken into account.
The study may involve a single case, but more commonly involves multiple cases, selected carefully to enable comparison.
 
Community-Based Research, Community-Based Participatory Research, and Action Research
Community-based research involves community members in the design and implementation of research projects, demonstrates respect for the contributions by community partners, as well as respect for the principle of "doing no harm" to the communities involved.
ASC projects, by definition, are conducted in communities. The degree of involvement of the community in the evaluation process can vary – see graphic for different degrees of community control in community based research.
Many ASC evaluation practices take a participatory action research (PAR) or a community-based participatory research (CBPR) approach. What distinguishes PAR from CBPR is that it is explicit in its recognition that the process of evaluation is itself an “action” that has a (hopefully) positive benefit.
Quantitative, qualitative and arts-based methods can be used in all types of community-based research.
Ladder of community involvement
Adapted from Arnstein, Sherry R. "A Ladder of Citizen Participation," JAIP, Vol. 35, No. 4, July 1969, pp. 216-224.
Quantitative Surveys
If you want to do a quantitative evaluation using primary data, you will need to have a survey instrument.
The survey should:
  • have a clearly defined outcome
  • be well organized and have concise questions
  • be easy for the participants to understand
Quantitative evaluations should have closed-ended survey questions whenever possible to simplify analysis of the data. Having some open-ended questions, to allow survey respondents to write whatever they want as well.
Often there are established surveys to measure the outcomes you are evaluating. Using an existing validated scale could make the results of your study stronger.
Survey
Examples of Scales That Have Been Used to Evaluate ASC Projects
Working with Children
Evaluating programs involving children may introduce special considerations. For example, a few of the scales listed above are specific for children. Arts-based methods may also be suited for using with children, as they may be more accessible and provide age-appropriate ways for children to express themselves.
In addition to age-appropriate evaluation methods, other considerations for working with children include power dynamics and consent. For example, the age difference between children participants and adult evaluators may introduce power dynamics which in turn could affect the evaluation process. In addition, there may be specific considerations for obtaining consent from children to participate in the evaluation, such as whether the children have the capacity to understand the evaluation and its risks and benefits and/or whether parental consent is required.
There are examples of research and evaluations of art for social change projects for children in the Examples section. Under the “Population” filter on the left-hand side, you can filter by age groups including preschool and school-aged children.
Survey Administration
Surveys can be self-administered, or can be administered by another person conducting the survey (in person, over the phone, etc.).
Self-Administered

Pros
  • Fewer resources are required to conduct surveys.
  • There are many ways to distribute the survey (mail, email, website, etc.)
  • Confidentiality can be ensured
Cons
  • A lower proportion of the participants will complete the survey, leading to non-response bias
  • Volunteer bias
  • Recall bias
  • Reporting bias
  • Response bias
In-person / Over the phone

Pros
  • Higher participation rate
  • No technical roadblocks for the participant
  • Opportunity for participant to ask questions and clarify
Cons
  • More resource intensive
  • Not anonymous - participants may not want to answer honestly to avoid embarrassment (social desirability bias)
  • Volunteer bias
  • Recall bias
  • Interviewer’s bias
  • Recording bias
  • Observer’s bias
Creating Your Own Survey
If there isn’t an existing survey instrument that measures your outcomes, you may need to create your own survey. Or you may want to add some additional questions to an existing survey.
  • Beware of biases that can be inadvertently introduced
  • Keep questions as simple as possible, and avoid asking about more than one concept in each question. For example, do not ask, “rate how you feel about your diet and the amount of exercise you get”; the participant may feel great about their diet and not good about their exercise, so will not know how to respond.
  • More tips and guidelines for creating your own survey
Use an existing validated scale whenever possible. Developing your own validated scale is a difficult and time-consuming process, and would be outside the scope of most ASC projects.
Sample Survey
For an example of a survey, see the audience questionnaire that was used by a team at the University of Lethbridge for a research study on a mixed abilities dance-drama production entitled Unlimited. The survey was given to audience members at the final performance.
Survey Questions
Creating Your Own Survey: Likert Questions
If you ask a Likert question:
  • Label what each extent of the range means
  • Consider a suitable range for the construct being measured:
    • A unipolar range represents a continuum from zero to an extreme. For example: 1 = "not at all useful", 2 = "slightly useful", 3 = "moderately useful", 5 = "very useful", 5 = "extremely useful".
    • A bipolar range has opposite end points with a neutral midpoint. For example: 1 = "strongly disagree", 2 = "disagree", 3 = "neither agree nor disagree", 4 = "agree", 5 = "strongly disagree".
  • There is controversy as to whether all questions should go in the same direction, with 5 the best and 1 the worst outcome, or whether some questions should be phrased in the opposite way, where 5 is the worst outcome. It is easier to analyze and less confusing for the respondent if they are all in the same direction. However, when the directions switch, it requires the respondents to more carefully read each question, which arguably has advantages.
  • View examples of Likert scales to help develop Likert questions.
  • Visit the American Youth Circus Organization (AYCO) Program Evaluation Toolbox to access sample surveys and corresponding user guides.
Likert Scale
Secondary Data
Quantitative data can also be gathered from existing sources. This is called secondary data.
For example, an ASC project concerned with whether engaging in community-based arts increases grades for at-risk youth can look at youth transcripts (with informed consent), or decreased school drop out rates in the community as a whole by obtaining the data from the school board. This would be secondary data.
An ASC project concerned with whether engaging in community-based arts decreases the crime rate for young offenders could look at criminal records. This would also be secondary data.
Secondary Data
Quantitative Data Sources
As mentioned in step 4 of this guide, quantitative data can either be:
  • Primary Data: data you collect for the purpose of your evaluation. For example, the results of a survey that you conducted.
  • Or, Secondary Data: data taken from existing sources. For example, obtaining school drop out rates from the school board.
The following information about analyzing quantitative data applies to both primary and secondary data.
Primary Data
Interviews
Interviews, often called in-depth interviews or key informant interviews in evaluation, are conversations between an evaluator (interviewer) and a respondent (an interviewee) in which questions are asked in order to obtain information used to evaluate a program.
  • Data collected from interviews may be used to better understand the respondent’s unique perspectives, opinions, and worldviews.
  • Conducting the interview itself is as much “art” as “science”
    • being a successful interviewer requires practice
    • having someone with prior experience is beneficial
    • the interviewer should be able to put the participants at ease and probe the relevant and useful responses
How many interviews are needed?
There is no fixed rule for a minimum number of interviews. The guiding principle to determine the number of interviews needed is saturation. Saturation means you are no longer collecting new information from additional interviews. When you are repeatedly hearing the same information without anything new, you have reached saturation.
Interviews
Photo by David Davies, distributed under a CC BY-SA 2.0 license.
Types of Interviews
  • Unstructured Interviews
    • informal and conversational
    • no pre-determined questions are asked and the interviewer “goes with the flow”
  • Semi‐Structured Interviews
    • most commonly used among evaluators
    • interviewer develops an interview guide consisting of a series of predetermined questions
    • may also include several probes that the interviewer hopes to use to elicit useful information from respondents
    • some flexibility in that the interviewer may not ask the same questions in the same ways to all respondents and may use their judgement go off script if their interest is piqued by something a respondent answer
  • Structured Interviews
    • do not allow the interviewer any flexibility
    • each respondent is asked the same exact questions in the same exact order
    • essentially the administration of an open-ended questionnaire
 
Interview Guides
In semi-structured and structured interviews, the interviewer uses an interview guide or protocol consisting of a series of pre-determined questions.
Tips for preparing an interview guide include:
  • Document the interview time, date and place, as well as the names and positions of the interviewer and interviewee
  • Allow space to take notes for each interview question, in case the recording does not work
  • At the start of the interview, briefly describe the purpose of the interview and ask the interviewee if he/she has any questions
  • Start with an easier question to warm-up
  • Keep questions simple and brief
  • Ask only one question at a time
  • Use open-ended questions
  • Avoid yes/no questions
  • It may be helpful to ask situational questions such as:
    • “Can you tell me about…?”
    • “Do you remember an occasion when…?”
    • “What happened when….?”
    • “What did you do when…?”
  • Interview questions are often derived from the research questions, phrased specifically for the interviewee
  • Revise the interview questions through pilot testing
  • At the end of the interview, ask the interviewee if he/she has anything to add and/or any questions
References
Creswell, J. W. (2013). Qualitative inquiry and research design: Choosing among five approaches (3rd ed.). Los Angeles: SAGE Publications.
Kvale, S., & Brinkmann, S. (2015). InterViews: Learning the craft of qualitative research interviewing (3rd ed.). Los Angeles: SAGE Publications.
Interview Advantages
  • Can elicit insight into each participant’s perceptions, opinions, beliefs, and attitudes
  • More appropriate when there is anything sensitive about the feedback that participants may not feel comfortable sharing in front of other people
Interview Disadvantages
  • Requires skilled interviewers and preparation (as do all methods)
  • Costly and time consuming if many people are to be interviewed
Interviews
Focus Groups
A group of participants are engaged in discussion (about their perceptions, attitudes, beliefs, opinions, impacts, challenges, barriers, accomplishments, etc.) with a group facilitator
  • usually there are 6-12 people in a group
  • having too many people can reduce the quality of the discussion
  • sessions usually last about 60-90 minutes
    • too short, and participants may not have enough time to develop their thoughts
    • too long, and it may be too inconvenient for participants
The group facilitator should:
  • prevent one or more people from dominating the group
  • encourage quiet participants to contribute
  • obtain responses from the entire group in order to ensure all perspectives are represented
Focus Group
Photo by USAG-Humphreys, distributed under a CC BY 2.0 license.
Focus Groups Advantages
  • Allows input from more people and produce rich data in a short period of time
  • Relatively inexpensive
  • Allows brainstorming, with one person’s thoughts nurtured by someone else’s, helping people remember events and ideas
Focus Groups Disadvantages
  • It is essential that the power dynamics in a focus group be carefully considered. For example, it may be difficult for someone to speak openly if this person’s boss is also in the focus group
  • May require an even more skilled facilitator than individual interviews because of the need to manage group dynamics
  • The group culture may interfere with individual expression
Focus Group
Photo by USAG-Humphreys, distributed under a CC BY 2.0 license.
Observation
There are two types of observation that can be used to gather qualitative information:
Direct Observation
In direct observation, the observer is not involved in the activity or situation being observed. The observer aims to be as inobtrusive as possible in order to not bias the observation.
Participant Observation
In participant observation, the observer is actively involved in the activity or situation being observed. For example, the observer can assist the facilitator while conducting an observation.
Hawthorne Effect
The Hawthorne effect refers to the tendency of study participation to affect the results. People who know they are participating in a study or evaluation may be influenced by the fact that they are being observed and therefore may act differently than if they were not being observed. This can be difficult to avoid completely, particularly in participant observation where the observer is actively involved, but it is important to be aware of especially in trying to be unobtrusive during direct observation.
Document Review
In document review, also referred to as document analysis or discourse analysis, documents are interpreted by the researcher to give voice and meaning around an assessment topic. You can review documents to understand the philosohpy of the program you are evaluating.
Analyzing documents may incorporate coding content into themes similar to how focus group or interview transcripts are analyzed.
For example, reflection documents written by project participants can be analyzed for how things are represented with vocabulary, and common terminology distilled from the documents to highlight themes.
Document Review
Photo by Meaghan O'Malley, distributed under a CC BY 2.0 license.
Narrative Inquiry
Narrative inquiry is the study of lived and told stories to understand experiences, underlying thoughts, values and/or assumptions.
Central to narrative inquiry is the theory that people make sense of the world around them through stories, and therefore narrative inquiry seeks to uncover the underlying beliefs and experiences as told through stories. Another important feature of narrative inquiry is context; recognizing the interactions between the teller, the listener and the broader social and cultural contexts of the storytelling.
In narrative inquiry, the analysis focuses on why and how the stories are told rather than the literal telling of the story, interpreting the stories to uncover underlying narrative structures.
Ways of collecting data for narrative inquiry include:
  • Journal records
  • Story telling
  • Letter writing
  • Autobiographical and biographical writing
References:
Bell, J. (2002). Narrative Inquiry: More Than Just Telling Stories. TESOL Quarterly, 36(2), 207-213.
Connelly, F. M., & Clandinin, D. J. (1990). Stories of experience and narrative inquiry. Educational Researcher, 19(5), 2-14.
Riley, T., & Hawe, P. (2004). Researching practice: The methodological case for narrative inquiry. Health Education Research, 20(2), 226-236.
Journaling
Art-Based Evaluation
Art-based evaluation (ABE) uses creative activities as a way of expression. Surveys, interviews, and focus groups all have their limitations; art-based methods explore concepts and ideas that might be difficult or uncomfortable to communicate in other ways, so is a useful complement to other methods.
Techniques used in ABE include participants exploring the research subject, expressing their feelings, and sharing their perspectives through:
  • Photography
  • Theatre
  • Drawing
  • Film/Video
  • Poetry
  • Dance
  • Music
  • And many other art forms
Often the art form that is used in your ASC project will determine or influence which arts-based evaluation technique you select.
While it is important to plan for and prepare the evaluation methods in advance of implementing the project, remember to also check in throughout the project and evaluation process to ensure the proposed arts-based methods are still suitable, keeping in mind the theory of change that originally informed the evaluation methods.
ABE Crafts
Photo by San José Library, distributed under a CC BY 2.0 license.
An example:
The lead author of this web-based evaluation tool (Dr. Annalee Yassi), along with an interdisciplinary international team co-led by Dr. Jennifer Spiegel, conducted a large multi-method study on social circus in Ecuador, funded by the Canadian Institutes of Health Research. Arts-based methods used in the study included a photovoice exercise and performative inquiry, led by Judith Marcuse, with the participation of Dr. Lynn Fels and Dr. Spiegel, as well as Ecuadorean colleagues (see Judith Marcuse, Lyn Fels, Katherine Boydell and Jennifer Spiegel. Through their own bodies, eyes and voices: Social circus, social inquiry and the politics of facilitating collectivity. In The Art of Collectivity: Social Circus and the Cultural Politics of a Post Neoliberal Vision, McGill Queens University Press, under review.)
What is performative inquiry?
Performative inquiry is a form of research or investigation that is explored by actively engaging with participants through creative process, such as Boal-style image theatre. Through the creative process, the participants and researchers explore, reflect and learn from “stop moments” – moments that make us pause to further question, explore and reflect.
Performative inquiry is guided by the questions:
  • What if?
  • What happens?
  • What matters?
  • So what?
  • Who cares?
How to use performative inquiry
Watch a 3-minute animated scenario with real video clips > (video coming soon)
Reference:
Fels, L. (2012). Collecting data through performative inquiry: A tug on the sleeve. Youth Theatre Journal, 26(1), 50-60.
What is Photovoice?
In photovoice, participants are asked to photograph images that represent something important to them related to the subject or program in question. Usually they are then asked to explain why they took the photo, and this information can then be analyzed for research or evaluation. It is important that the choice of photos remains in the hands of the participant-photographers, not the researcher/evaluator.
In the study on social circus in Ecuador, photovoice was used to help better understand the social realities and challenges faced by the participants in their communities. It began with an introductory workshop, which included:
  • A quick process to help participants to “read” images and to reflect on their own daily experiences outside of circus. This first exercise focused on how the same image could be interpreted in many different ways.
  • A discussion of the ethics of visual representation.
  • Instruction on the use of the cameras, including a request to focus on content that was important to each of them, and to choose two photographs that they felt best about out of however many they took (of a suggested maximum of 30 images).
Then for the following few days, participants took photographs that symbolized aspects of their lives that were important to them, whether positive, negative or neutral, and were urged to reflect on and take photos of what mattered to them in their daily experiences outside of circus.
When the participants came back together in the follow-up workshop, their chosen photos had been printed and laid out on the floor for everyone to see. Facilitation was then used to lead both individuals and the group to dig deeper into possible meanings, both literal and metaphorical, of these images. Group discussion questions included:
  • What do you see?
  • What does this image make you think about?
  • How do you and your colleagues react to your photography?
  • What meanings, feelings or interpretations do you and others give to photography?
Questions for the photographer included:
  • Why did you take this picture?
  • What problems, conditions, experiences, environments or relationships do your photo represent?
Insights for Research and Evaluation
Many insights were generated through the sharing of the photographs and dialogue.
Photovoice Discussion
The group discussed the meanings, thoughts and feelings that the photographs evoked.
Examples of photos and interpretations
Below is a collection of six photos from the social circus study in Ecuador and the photographer’s own interpretation of each photo.
Alex
This is the place where we work and is a place where we always share with many artists from different backgrounds. This is the only place we can be who we really are. Every time we have to put on a show, they tell us how to do it but in this place [the picture] is who we really are. Everyone has their own role and style… This is the place where we slowly started to grow in the circus. This is where we developed our skills…. People walking on the street will stay and watch if they like it. It’s not like a paid show, where you go in and watch. You almost have to stay for the whole show since you already paid. In this case it’s different. If they like you they will stay, if not, they’ll leave. …. I also think that thanks to the circus, many people have been able to overcome some bad things. It helps you live in a different way. …Sometimes there are people that stop and tell you ‘I did not know you were from Ecuador’, they like it and are surprised about that. Other people have very stressful lives or jobs but they go to ‘La Ronda’ for a little while, watch the show for a bit and they leave happier, they forget about their problems, at least for a moment. …. I love to watch their expressions, when I see they look happy I continue to work on that; if I see other reactions then I switch to another routine. I present in a different way to please the majority of the audience. It has to be fun for them and for me.
Jorge
This [landscape] is what I see every time I leave my home. Down here is my house, at the front the Panecillo monument. [This image relates to social circus] [b]ecause throughout life we must deal with our environment and also find many paths, know which one to choose, decide and the type of people we engage and socialize with…. There are amazing things human beings can accomplish, like put a statue) at the top of the mountain. Stand on other’s people arms and maintain your balance, which is very hard to do. The circus, life, the picture I took here are all very real; there are many difficulties in life and we must deal with them.
Pablo Muñoz
My picture is about a group of friends – classroom friends. That day we were celebrating, being together. My message is about unity, teamwork… The picture is about a group of people jumping together, equally, that’s all. They are happy.
Fernando Rodriquez
These kids were at an artistic event in the south part of Quito. Despite the shows and good artist performances going on, the kids started spontaneously to work together, in groups… They started to build the first pyramid, all the kids were gathered as if they were doing communal work (minga) to form this pyramid. They were not concerned that the train was about to come by and that would make the pyramid fall. As you can see in this picture, they built it again. I like the moment, when something breaks, when something that you build falls apart, you can rebuild it again without any concerns… This means a lot because it provides a lesson to me. When this type of situations happens, when we have problems, sometimes things that are in place can fall apart so easily. Then we must reconstruct, we must use the same passion, enthusiasm as before. Have fun and not be afraid…
Jorge Hidalgo
I took this photo because this knot was supporting many anchors around it and it was the centre of everything. How you see it here, it’s falling apart, but its due to the strength and how it’s being pulled from all different directions…. Colleagues, teamwork [make it stronger], release some weight , and maybe another person takes over if someone feels too tired.
Fernando Rodriquez
It’s part of the culture. People judge you but they don’t provide any help / support. The important part was that when I took this picture, the police was going by and they did not see it as a risk. This man was at risk, he could be hurt, he could vomit and choke…
What we learned from this exercise
The participants’ responses and discussion strengthened the analysis of what the social circus means for those involved and how it is experienced in practice.
Themes that emerged from the exercise and were reflected in the photos included:
  • Joy derived from the social circus
  • Satisfaction linked to the mastery of circus techniques
  • The place of the circus within their lives
  • Values related to what was learned in the social circus, such as:
    • Desire to "go further"
    • Importance of artistic expression
    • Value of friendship and teamwork
    • Rejoicing and pride that come through the effort
  • Reality, environment and social concerns
  • Space of spirituality
  • Family's place in society
  • Search for the reaffirmation of identity and the rediscovery of indigenous roots
This participatory arts-based evaluation method was thus an important component in our overall understanding of the benefits of the arts-for-social-change project we were studying.

For more detailed instructions on conducting ABE techniques, visit:
References:
Boydell K, Belliveau G. (2017). Situated methodologies: A critical inquiry into art-based research methodologies. Journal of Applied Arts & Health. 8(2):135–9.
Boydell KM, Gladstone BM, Volpe T, Allemang B, Stasiulis E. (2012). The production and dissemination of knowledge: a scoping review of arts-based health research. Forum Qualitative Sozialforschung / Forum: Qualitative Social Research.
Jager A de, Tewson A, Ludlow B, Boydell K. (2016). Embodied ways of storying the self: a systematic review of body-mapping. Forum Qualitative Sozialforschung / Forum: Qualitative Social Research. 6;17(2).
Foundations of Qualitative Research in Education. Arts-Based Research
Charlton, M. (2007). Art-Based Evaluation 101
Marcuse J, Fels L, Boydell K, Spiegel J. Through their own bodies, eyes and voices: Social circus, social inquiry and the politics of facilitating collectivity. In The Art of Collectivity: Social Circus and the Cultural Politics of a Post Neoliberal Vision, McGill Queens University Press. Under review.
Arts-Based Approach to Stigma Reduction

There are many efforts to reduce stigma and discrimination, including the stigma against mental illness or infectious diseases such as HIV or even tuberculosis (TB). In this example, an arts-based approach was used to help healthcare workers in South Africa better understand stigma and discrimination in the healthcare workplace.
The arts-based stigma exercise was completed in a group with the participants standing in a circle. A simple three-phrase dialogue (see below) was repeated in pairs one at a time, going around the circle. If a participant made a mistake in the dialogue, she/he received a sticker on the forehead at which point she/he would assume the name “one spot” instead of “John” in the dialogue. If another person mistakenly referred to a “one spot” as “John,” she/he would also receive a sticker on the forehead. Sometimes even when a person got every right they would still receive a sticker arbitrarily. Participants who made multiple “errors” accumulated multiple dots, thereby becoming “two spot,” “three spot,” and so on. The exchanges continued around the circle until the facilitator stopped the exercise for a group discussion.
This exercise serves as an example of how arts can be used to help surface how people think about stigma. Through the exercise, participants feel some of the feelings that might be associated with being stigmatized or discriminated against, which helps to generate discussion before and after the exercise.
Watch a 3-minute video with real video clips (video coming soon)
This stigma exercise was part of a larger research study focused on evaluating and reducing HIV and TB related stigma in the healthcare workplace. The exercise is itself an arts-for-social-change initiative to reduce stigma and discrimination, but the exercise can also be seen as an arts-based technique to help evaluate how a program to reduce stigma can be strengthened.
Why spread the information?
It is useful to let others know what you have found in your evaluation. For example, your findings can help convince policy-makers of the value of your ASC project for bettering social outcomes. Or other ASC practitioners can learn from your experience.
We will present some of the different forms of dissemination, or ways to spread the information from your evaluation.
Spread
Text-based information sharing
Reports
Writing reports is one of the most common forms for sharing your results. The style of the report will depend on your audience, and can include pictures, drawings, and other components to reflect the artistry of the ASC project.
Academic articles
The writing of academic articles is a good way to share results if your evaluation adds something new to world knowledge, and has been evaluated in conjunction with experts in the field.
Other ways to share text-based information
Your report could be shared online, it could be summarized and printed into a booklet, or could be adapted for a newspaper article.
Text-based
Oral information sharing
Conferences
Many conferences at the local, national, or international level welcome discussions about the social impacts of an ASC project. Presenting at conferences ensures that your ASC project results are known within the ASC community.
Meeting with policy makers
Sharing your evaluation results with policy-makers can provide an evidence base for changes in policies related to marginalization and community arts. You can meet with policy makers or suggest a change through a briefing note.
Community town hall meetings
Presenting your findings at community town hall meetings can inform the community about your ASC project and how it promotes social change. It is always a good idea to provide feedback and share your results with people who are stakeholders in your project, for example with pamphlets, one-page summaries, or drawings.
Oral
Social media-based information sharing
The ubiquity and widespread use of social media platforms like Facebook, Twitter and Instagram make them a valuable tool to disseminate information from your evaluation, in particular to reach a broad audience and to stimulate conversation.
A few considerations for social media-based sharing:
  • Use images: social media is very visual
  • Engage with users: reach out to users with similar interests and actively respond to users who engage with your content
  • Connect with communities: tap into existing conversations on similar topics by using relevant hashtags and monitoring ongoing conversations and influencers
  • Write for social: like other media, social media has its own set of conventions around style, language and tone
  • Monitor the analytics: platforms such as Facebook and Twitter provide metrics so you can track visitors and learn about your audience
If your organization does not have a social media account, be sure to carefully consider your strategy, including objectives and target audience, as well as the time and resources required to manage social media accounts before setting one up. Managing social media requires significant time and resources on an ongoing basis to produce content, engage with users, and maintain a presence. If you don’t have a social media account, ask partners and other organizations to help share your findings through their channels.
Social Media
Arts-based information sharing
When working with the arts, dissemination methods can include artistic/aesthetic qualities. It is important to note that arts-based dissemination and the other types of dissemination such as reports and academic articles are not mutually exclusive. Dissemination methods can include:
  • exhibition of the participants’ creation
  • a dance performance by professional artists based on the data
  • videos
  • a mural depicting participants’ experience during the ASC process
Examples of arts-based evaluation/dissemination
Jumblies Theatre explored and experimented with many approaches to arts-based evaluation. Follow this link for an example of Jumblies arts-based evaluation.
The UBC Learning Exchange used theatre to share evaluation findings with the wider community. Learn more about the play – titled Voices UP! – and read the comic book created about the process.
ASC
Analysis
Analysis is the process of turning collected results into meaningful information so is a crucial part of any evaluation. A well-conducted analysis will yield evaluation findings that you can use to strengthen your program.
The techniques used to analyze information collected depend on the type collected and what you hope to learn. There are no hard and fast rules for analyzing information – analysis is itself both an ‘art’ and a ‘science.’ That said, it is crucial that analysis follows a methodical and systematic approach to ensure that you don’t draw incorrect or inappropriate conclusions.
Strategies for analysis should be considered before information is collected during the evaluation design stage.
Third-Party Analysis
Without training in analysis techniques, it may be best to consult a professional for guidance or to enlist a professional to take a lead role in conducting the analysis, interacting with you frequently to ensure that the analysis answers the questions that you feel are most important. The Statistical Society of Canada may be a good resource if you don't already have a statistician in mind.
Note: You cannot just give the information you collected to someone else and say “analyze it”. There are a huge number of options as to how to approach the large amount of information you have gathered – and it is essential that you stay actively involved in ensuring that the data analysis is structured to answer the right questions.

Evaluative Research Mini Course

Visit the Evaluative Research Mini Course for more advanced information on quantitative analysis.
Information Quality
The following constructs are often used to assess information/data quality:
  • Validity: Information measures what it is intended to measure.
  • Reliability: Information is measured and collected consistently according to standard definitions and methodologies; the results are the same when measurements are repeated.
  • Completeness: All elements are included (as per the definitions and methodologies specified).
  • Precision: Information has sufficient detail.
  • Integrity: Information is protected from deliberate bias or manipulation for political or personal reasons.
  • Timeliness: Information is up to date (current) and is available on time.
Tips to Improve Data/Information Quality
  • Use standardized collection tools, which have already been tested in real life situations
  • If you need to make changes to adapt tools to your local context, you should try to conduct a pilot test to improve the tool before using it more generally
  • Use experienced collectors when possible
  • Provide training for collectors on the specific tool and/or supervise collection to reduce bias (e.g., inappropriate prompting for answers during interviews) and errors (e.g., misunderstanding which program elements need to be observed)
  • Consult key stakeholders (e.g., program staff and participants) throughout the evaluation process (participatory evaluation)
Data/Information Management
It is crucial to develop effective and consistent information management processes for:
Even the most rigorous collection effort could have inaccurate or missing information. Data/information cleaning involves finding and dealing with any errors that occur during the collecting, storing, transferring or processing of information.
Identifying Objectives of Analysis
Understanding the topic/issue being investigated as well as its relationship with relevant social, economic and/or environmental factors is essential to guide the analysis effort. Specifying your objectives and formulating a set of questions to be answered by analyzing the information is critical to having a meaningful evaluation.
Questions you may consider are:
  • What is the topic or issue?
  • What is the context? For whom and under what circumstances?
  • How will the analysis be used?
At this stage, it may also be useful to formulate a set of expectations for what the information will reveal. An understanding of why certain patterns may emerge and what they may mean will help with analysis and drawing conclusions. Additionally, It may be useful to define upfront what constitutes “success” by constructing specific guidelines.
Determining Appropriate Techniques for Analysis
Before commencing analysis, it is necessary to determine which analytical techniques are appropriate for your information set. Options for analysis can largely be grouped into options for quantitative data and options for qualitative results. We will also explore the less well-developed area of arts-based evaluation results analysis options.
Evaluation results from different sources may suggest different things, but knowledge of the context as well as limitations of the methods should help you make sense of this apparent discrepancy.
You may proceed to some more advanced topics of analysis below:
Quantitative Data Analysis
With quantitative data, the goals are to describe patterns in the numbers collected and explore relationships or effects. Analysis will vary based on the data collection method used.
You could start by running a frequency distribution to see how each question was answered by the respondents. For example, how many people gave a question 5 out of 5 for level of agreement, how many said 4, etc. so you can see how much variability there is on each question. This is called univariate analysis.
Once this has been done, you can decide which variables are important to look at separately. For example, do you want to see how many females answered each question a certain way compared to males. This is called bivariate analysis.
Tips for Quantitative Analysis:
  • The level of data analysis should be appropriate to the data gathered. For example, if the sample is small, sophisticated data analytic techniques may not be warranted, and statistical analysis may make no sense.
  • Results should be interpreted with caution, particularly where a change is observed
  • All data collected as part of the evaluation should be included in the analysis to reduce bias and improve the validity of the evaluation findings
  • It is important to consider response rates and missing data
  • It is recommended that the evaluator ask a peer to look over their analysis and to verify their interpretations of the data to reduce bias and improve the credibility of the findings
  • It is particularly important to triangulate quantitative data with observations and knowledge from other means, to ensure everything makes sense. It is essential that the report be reviewed with people who know the context.
  • For more in-depth analysis, it is recommended to consult an evaluation consultant or an academic partner with the necessary expertise
Constructing a Measurement Matrix
A common mistake made by evaluators is failure to develop a clear analysis plan at the outset. In order to maximize the usefulness of quantitative data collected, it is paramount that evaluators decide how they will use all information collected by painting a clear picture of the variables that will be constructed from questions asked, as well as analysis procedures that will be used.
One useful tool to clarify these plans is to construct a Measurement Matrix, which displays how each item in a survey will be used to address major evaluation constructs. For each survey question, the matrix may identify:
  • the study concept it intends to operationalize,
  • the level of measurement,
  • the specific objective/hypothesis addressed,
  • the scales from which questions were drawn and their reliability and validity, and
  • the intended analysis.
Creating this matrix challenges the evaluator to consider the usefulness of each item in terms of their objectives and consider which items may be removed or added.
Preparing Quantitative Data for Analysis
Quantitative data must be entered or imported into spreadsheets in data analysis software such as Microsoft Excel or more advanced software programs such as SPSS, SAS, R, or STATA.
Data should be coded so that all data are in number form and cleaned.
You must also decide how to deal with missing data.
Types of Quantitative Data
Categorical data have a limited number of possible values.
  • Nominal: Numbers assigned to categories do not necessarily have inherent meaning and the order of the categories may be arbitrary. For example, when asking about marital status, there are a limited set of possible responses and categories can be ordered in numerous ways (e.g. 1 = “married”, 2 = “not married”).
  • Ordinal: Data are ordered, but the distances are not quantifiable (you cannot add or subtract). A question where the responses range from 1 = “strongly agree” to 5 = “strongly disagree” is an example of this type of categorical data.
Continuous data can have almost any numeric value along a continuum and can be broken down into smaller parts and still have meaning. Age, weight, height, and income are all examples of continuous data.
  • Interval:Data is like ordinal except we can say the intervals between each value are equidistant. This allows us to order the items that are measured and to quantify and compare the magnitudes of differences between them. For example, the difference between 20 and 21 degrees Fahrenheit is the same magnitude as the difference between 70 and 71. Data can take on positive or negative values.
  • Ratio: Data is like interval data, but with a true zero point, meaning you can have nothing less than zero (no negative numbers). When the variable equals 0, there is none of that variable. For example, time is ratio since 0 time is meaningful. Variables like height and weight are ratio variables. Data are continuous positive measurements on a nonlinear scale.
Types of Analysis: Descriptive Analysis
Descriptive statistics are simple quantitative summaries of the characteristics of the data set you have collected using totals, frequencies, ranges and averages. This helps you understand the data set in detail and put the data in perspective. Descriptive statistics do not allow us to make conclusions beyond the data we have analysed or reach conclusions regarding any hypotheses we might have made.
Types of Analysis: Inferential Analysis
Inferential analysis involves making statements, or inferences, about the world beyond the data you have collected. These analytical techniques can enable you to gain a deeper understanding of the data, including change over time; comparison between groups; comparing like with like; and relationships between variables.
Inferential statistics enable the evaluator to make judgments about how likely (the probability) an observed outcome is due to chance.
Inferential statistics:
  • Infer from the sample to the population
  • Determine probability of characteristics of the population based on the characteristics of your sample
  • Help assess strength of the relationship between your independent (causal) variables, and you dependent (effect) variables.
Why use inferential statistics?
  • Many peer-reviewed academic journals will not publish articles that do not use inferential statistics
  • Allows you to generalize your findings to the larger population
  • Allows you to assess the relative impact of various program inputs on your program outcomes/objectives.
Parametric inferential statistics: Used for data that follow an approximately normal distribution (e.g., parallels a bell curve). Used for interval or ratio scales
Non-Parametric Inferential Statistics: Used for data that do not follow a normal distribution (ie, the distribution does not parallel a bell curve). Used for nominal or ordinal data.
Graphical Analysis and Visualization
Data visualization is a powerful tool for both the analysis and communication of evaluation findings. Graphical analysis is a useful way to gain an instant picture of the distribution of data and to identify any relationships in the data that may require further investigation and may otherwise be difficult to discern. A range of graphical techniques can be used to present data in a visual format (e.g., column graphs, row graphs, dot graphs, and line graphs). Selecting which type of visualization to use will depend on the nature of the data. Different types of visualization may be better suited for data analysis and communication, respectively.
For further information on specific methods of data visualization, see BetterEvaluation.org.
Example of Data Visualization
The examples shown below all visualize the same data.
Data analysis
For further information on specific methods of data visualization, see BetterEvaluation.org.
Univariate Analysis (one variable)
The first step to understanding a data set is to look at each variable in detail, one at a time, using univariate statistics. Even if you plan to take your analysis further to explore the linkages, or relationships, between two or more of your variables you are best to start by examining each variable very carefully on its own. Univariate analysis is useful for profiling the characteristics of participants, and can also help with identifying missing data, outliers, and low response rates.
Examples of Univariate Analysis
Frequencies, or counts, describe how many times something has occurred within a given interval, such as a particular category or period of time. For example, the number of sessions attended by a participant is a frequency. Frequencies can be used for categorical or continuous data.
Percentages are the given number of units divided by the total number of units and multiplied by 100. Percentages can be used for categorical or continuous data. For example, if 10 out of 20 participants are girls, Equation 
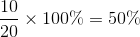
of participants are girls.
Ratios show the numerical relationship between two groups. For example, the ratio of the number of participants in a particular program (18) to the number of facilitators in that same program (3) would be 18/3, or 6:1. Ratios can only be used for continuous data.
Mean, median, and mode are three summary measures representing a central value of a distribution (also called measures of central tendency). A mean, or average, is determined by summing all the values and dividing by the total number of units in the sample. A median (the middle value) is the 50th percentile point, with half of the values above the median and half of the values below the median. A mode is the category or value that occurs most frequently within a dataset.
Range, inter-quartile range, variance, and the standard deviation are summary measures that provide information about how values are distributed around the centre, demonstrating how much variation there is in the data (also called measures of dispersion). The range is the difference between the highest and lowest scores in a data set and is the simplest measure of spread. The inter-quartile range is the difference between the upper and lower quartiles (three points that divide the data set into four equal groups, each group comprising a quarter of the data). The variance is a number indicating how spread out the data is. Standard deviation is a number representing how far from the average each score is.
Confidence intervals are used to estimate a value/score in a population based on the score of the participants in your sample. A 95% confidence interval indicates you are 95% confident that you can predict/infer the value/score of a population within a specified range based on the value/score of your sample.
Bivariate Analysis (2 variables)
Bivariate analysis involves looking at associations between pairs of variables and trying to understand how these associations work.
Questions to Consider in Bivariate Analysis:
  1. How big/important is the association
  2. Is the association statistically significant, meaning is it due to chance, or is it likely to exist in the overall population to which we want to generalize? Statistical tests answer this question.
  3. What is the direction of the association? (look at graphs)
  4. What is its shape? Is it linear or non linear? (look at graphs)
Test Statistics
Test statistics are inferential statistics that are used to test statistically how likely a relationship or difference between groups or variables is to be due to chance. Different statistical procedures use different test statistics (e.g., t-test, F-test, chi-square statistics). Since the “truth” of a theoretical hypothesis can never be known for certain, you can use test statistics to determine whether to reject the null hypothesis.
The “null” hypothesis is that any relationship or change observed is due to chance (e.g., that there is no difference or relationship between the variables). If you reject the null hypothesis, you are concluding that it is unlikely that an observation is due to chance alone - it may be an effect of your program or of some other variable.
The “alternative” hypothesis states that any difference or relationship is not random or due to chance.
In reading about quantitative analysis, you will often encounter the phrase statistically significant and read about the p-value. A statistically significant result is a result that is not attributed to chance. The test statistic is used to calculate the p-value. The p-value helps you determine the significance of your results.
  • A small p-value (typically ≤ .05) indicates strong evidence against the null hypothesis, so you reject the null hypothesis and therefore reject that the observation is due to chance.
  • A large p-value (> .05) indicates weak evidence against the null hypothesis, so you fail to reject the null hypothesis and assume that any observation is due to chance.
  • p-values very close to the cutoff (.05) are considered to be marginal (could go either way). Always report the p-value so your readers can draw their own conclusions.
Bivariate Analysis: Contingency Tables and Chi Square Statistic
When are they used?
When you have two categorical variables and you want to know if they are related (e.g., gender and score on outcome measurement).
How do you interpret them?
The chi-square statistics can be used to determine the strength of the relationship (e.g., goes knowing someone’s gender help you predict their outcome score/value). If the probability associated with the chi-square statistics is .05 or less (p ≤ .05), then you can assert that the independent variable can be used to predict scores on the dependent or outcome variable. You can also use the contingency table to compare the actual scores across the independent variable on the dependent variable or outcome measurement (e.g., compare the number/percent of males who agreed that the program had a positive impact on their lives to the percent of females who agreed.)
Bivariate Analysis: T-test or ANOVA
When is it used? When you have a categorical and continuous variable and you want to compare mean scores of two (t-test) or more groups (ANOVA) (e.g., you want to compare mean self-esteem score of program participants across race).
How do you interpret it? The t-test or F-statistic can be used to determine if the groups have significantly different means. If the probability associated with the F statistics is .05 or less (p ≤ .05), you can assert that there is a difference in the means.
Bivariate Analysis: Pearson Correlation
When is it used? When you have a continuous independent variable and a continuous dependent variable.
How do you interpret it? Pearson’s correlation is a statistical measure ranging from +1.0 to -1.0 that indicates how strongly two or more variables are related. A positive correlation (+1.0 to 0) indicates that two variables will either increase or decrease together, while a negative correlation (0 to -1.0) indicates that as one variable increases, the other will decrease. When the probability associated with the test statistic is .05 or less (p ≤ .05), you can assume there is a relationship between the dependent and independent variable. For instance you may want to know if the number of hours participants spend in your program is positively related to their scores on a self-esteem scale. Correlation quantifies the degree to which two variables are related. Correlation does not fit a line through the data.
Bivariate Analysis: Linear Regression
When is it used? Like Pearson’s Correlation, When you have a continuous independent variable and a continuous dependent (outcome) variable. With a correlation you don't have to think about cause and effect. You simply quantify how well two variables relate to each other. With regression, you do have to think about cause and effect as the regression line is determined as the best way to predict Y (the dependent variable) from X (the independent variable).
How do you interpret it? When the probability associated with the F statistic is .05 or less (p ≤ .05), you can assume there is a relationship between the dependent and the independent variable. Regression is a way of describing how one variable, the outcome, is numerically related to predictor variables. The regression equation (e.g., a+bX) can be used to make predictions on Y based on values of X.
Multivariate Analysis (more than 2 variables)
Multivariate analysis involves understanding the effects of two or more independent variable at a time on a dependent variable.
Questions to Ask in Multivariate Analysis
  1. How is a relationship between two variables changed if a third variable is controlled? (Multiple crosstabs, partial correlation, multiple regression, MANOVA)
  2. What is the overall variance of a dependent variable that can be explained by several independent variables. What are the relative strengths of different predictors (independent variables)? (Multiple regression)
  3. What groups of variables tend to correlate with each other, given a multitude of variables? (Factor analysis)
  4. Which individuals tend to be similar concerning selected variables? (Cluster analysis)
Multivariate Analysis: Elaborated Chi-Square statistic
When is it used? When you have more than one independent categorical variable, and one dependent categorical variable.
How is it interpreted? You divide one of the independent variables into two groups and then do a chi square for each group (e.g., divide gender into males and females and do a chi-square for males and one for females. For females you can do a chi square of outcome measurement by race, and then do the same for males).
Multivariate Analysis: Multivariate Regression
When is it used? Multivariate regression is used when you have more than one independent (causal) variable and one dependent (effect or outcome) variable. You not only want to know if your intervention has an impact on the outcome, but you want to know which aspects of your intervention has an impact and/or the relative impact of different aspects of your intervention
How do you interpret it? If the probability associated with the F statistic is .05 or less (p ≤ .05), the model as a whole likely has statistically significant predictive capability. If p > .05 none of the independent variables in the model are correlated with the dependent variable. If the probability associated with the T statistic for each of the independent variables is .05 or less (p ≤ .05), you can assert that independent variable has an impact on the outcome, independent of the other variables. A predictor that has a low p-value is likely to be a meaningful addition to your model because changes in the predictor's value are related to changes in the response variable. Conversely, a larger (insignificant) p-value suggests that changes in the predictor are not associated with changes in the response. The value of the T statistics can be compared across the independent variables to determine the relative value of each.
A useful overview of techniques for quantitative analysis can be found at BetterEvaluation.org
Qualitative Data Analysis
Qualitative analysis is sometimes poorly understood in evaluation and there is sometimes a sense that qualitative data are less authoritative or reliable than quantitative data. However, when executed rigorously and methodically, qualitative analysis can provide reliable and trustworthy insight into questions that cannot be answered by quantitative data, such as how and why a program may be effective or the meaning of an arts process to participants. In fact, it is important to stress that qualitative analysis is no less rigorous than quantitative analysis – it is just designed to answer different questions!
Qualitative Analysis vs. ‘Anecdotal’ Reporting
It is important to distinguish qualitative analysis from ‘anecdotal’ reporting.
It is sometimes thought that ‘anecdotal’ evidence, which often takes the form of personal testimonials or single case studies, will be effective in winning the hearts and minds of funders and policy makers. ‘Anecdotal’ evidence is different from systematic evidence collected through qualitative evaluation activities. ‘Anecdotal’ evaluation is unlikely to be taken seriously by people external to the project and contains so many inherent biases that it is unlikely to be useful for project development in the longer term. While telling stories can be useful, it may not be applicable to systematic evaluation as an individual story or anecdote cannot be generalized.
Conversely, balanced reporting of qualitative data that are methodically collected can produce rich, detailed evidence and stories that can inform advocacy and provide meaningful information to support project improvement. While some techniques and theories of qualitative research may be too complex for many project evaluation settings, the key principles from qualitative research can be usefully applied, especially committing to treat the information that you collect methodically, fairly and comprehensively and to avoid selecting out the examples that seem to tell the most exciting story or the story that funders and other external audiences are assumed to want to hear.
Tips to Improve Qualitative Data Quality
  • The interviewer or facilitator must be skilled at guiding the discussion without leading it to fit their own agenda.
  • The interviewer or facilitator must be especially sensitive to the instances when participants may feel inhibited or find it difficult to discuss challenges and problems that they have experienced within the project.
  • In addition to asking initial questions, the interviewer needs to be skilled at following up with prompts, ensuring that the interviewee is relaxed and that the process is not intrusive or upsetting.
  • It might be preferable to undertake these in naturalistic settings where project activity takes place so that participants are familiar with the setting and associate it with the activity being discussed.
  • Interviews that include sensitive topics should not be undertaken in settings where participants might be distracted by activity going on, or where there is no guarantee that the interview will not be interrupted.
  • Interviewers need to have in place a range of strategies for responding appropriately to a range of disclosures that may need action, and opportunities to debrief in case they themselves find the process challenging.
  • Analysis normally takes place on completion of the project. However, if the project is of a lengthy duration or a lot of data are gathered over the course of the project, it may be helpful to analyse data at intervals throughout the project to minimize the amount of work required post-project and also to ensure that any information gathered is still fresh in the evaluator’s mind.
Preparing data for analysis
When you are conducting interviews or focus groups, be sure to take notes and/or record the sessions so they can be transcribed verbatim later. You can use software such as Microsoft Office® and/or NVivo 10 to transcribe the audio recordings. Qualitative questionnaire responses and other documents may also be entered or imported into these software programs for analysis.
Resources
This tool is meant to introduce topics specific to qualitative analysis. Below are some additional resources if you would like to explore these topics in more depth.

Evaluative Research Mini Course

In addition to the resources, visit the Evaluative Research Mini Course for more advanced information on qualitative analysis.
Textual analysis
Content analysis: reducing large amounts of unstructured textual content into manageable data relevant to the (evaluation) research questions. (e.g., identifying the instances where particular words are used by participants in feedback forms.)
Thematic coding: recording or identifying passages of text or images that are linked by a common theme or idea allowing the indexation of text into categories.
Framework matrices: a method for summarizing and analyzing qualitative data in a two-by-two matrix table. It allows for sorting data across case and by theme.
Narratives: construction of coherent narratives of the changes occurring for an individual, a community, a site or a program or policy.
Timelines and time-ordered matrices: aids analysis by allowing for visualization of key events, sequences and results.
Thematic Analysis
Thematic analysis involves a step by step process that seeks to stay close to participants’ words, coding responses and successively grouping them so that overarching themes can be identified. It is useful for identifying patterns in qualitative data including similarities and differences, trends and unusual responses or cases. It can be undertaken relatively quickly and is easy to learn and allows evaluators to summarise a large volume of data.
  1. Familiarise yourself with the data by reading and rereading it.
  2. Generate initial codes. This entails working systematically to identify and name interesting items, especially if these are repeated. They could be words used by participants to describe their responses to a project. An inductive approach will stay close to participants’ language, while a more deductive approach may search for codes using a predetermined conceptual framework. Deductive approaches may seem more manageable in evaluation but they carry the drawback that the analysis might miss participants’ unanticipated responses.
  3. Group your codes into overarching themes. These might be different types of response, such as reported feelings, moods, creative challenges and other reflections.
  4. Review themes in order to gain a sense of what the different themes are, how they fit together, and the overall story they tell about the data.
  5. Define and name themes. This is an attempt to capture the essential character of each theme and show how it fits within the overall picture.
  6. Produce the report. The aim here is to tell the rich story of your data in a way that convinces the reader of the rigour of the analysis. This allows you to highlight out vibrant cases while showing how these fit within the overall body of information.
Resources for Qualitative Analysis
This tool is meant to introduce topics specific to qualitative analysis. Below are some additional resources if you would like to explore these topics in more depth.
Arts-Based Analysis
Data may be collected using arts-based methods such as drama, film, poetry, dance, photovoice, etc. In terms of true arts-based methods of data analysis, less has been written. In many evaluations of arts-based programs, more traditional forms of qualitative data are collected throughout the artistic process and analysed accordingly.
Arts-based methods should always be participatory, including the artist in the analysis. For example, participants in an evaluation using photovoice are asked to write captions for their own photos to inform the analysis of the images.
Arts-based data analysis is an emerging research area.
Examples
Visit the Examples page to see ways in which evaluators have approached arts-based data analysis.
Examples of Arts-Based Analysis
Some examples of ways in which evaluators have approached arts-based data analysis include:
  • Evaluators listen to or read transcripts of evaluation data and then move in the form of dance according to meaning being seen, heard or felt. Interpretations of the movement in terms of the raw data can then be shared and these interpretation can form the basis of themes that may be connected with other themes that form the evaluation story (Simons & McCormack, 2007).
  • Working with nurses in cancer service, movement, narratives, stories, poetry, collage, and creative writing were used, with data analysis performed by subgroups that played with transcripts, pictures, and poems to derive themes and categories to explain the quality of clinical practice, which were then explained to other subgroups that agreed, challenged, or extended interpretations. In this way, data are transformed from “cold data” into dynamic, creative, and embodied forms, and interpretation takes the form of artistic creation (Buck et al., 1999).
More Examples of Arts-Based Analysis
A few more examples of ways in which evaluators have approached arts-based data analysis:
  • In an alternative approach to evaluating sexual health promotion, dramatized sexual scenes provide a context within which to analyse many of the behavioural and epidemiological factors associated with sexual practice and offered an entry point for dialogue. Participants’ analysis of narratives through a dramatized scene offer a testimony to sexual experience in their own terms. Evaluation is conducted collaboratively in examining changes in sexual scenes at multiple time points (e.g., 3-month, 6-month or 12-month intervals). Change is examined on an individual and structural level (Paiva, 2005).
  • An a/r/tographical framework is a method which links art, research and teaching, and privileges both text and image. (Garcia Lazo & Smith, 2014).
  • Photo-elicitation is the process of analyzing photos taken by the evaluator or the participant in the data collection process to gain insights into social phenomena that oral or written data cannot provide. (Lapenta, 2004).
Issues to Consider in Arts-Based Analysis
  • Arts-based evaluation can open new ways of seeing and understanding, incorporating both emotion and intellect
  • Arts-based data sources are often less tangible than numbers or transcripts and may therefore be less amenable to standard criteria
  • Participants must overcome inhibitions and fear of being judged
  • Arts-based evaluators may need a specialized skill set in both evaluation and artistic techniques
  • Must be careful that focus on art-making and creative expression does not overshadow the evaluation
  • We must broaden our concept of validity to embrace understandings gained from arts-based expression
For more info and for an exploration of possible criteria for arts-based evaluation and conceptualizations of external validity, see Integrating Arts-Based Inquiry in Evaluation Methodology written by Simons & McCormack.
Mixed Methods
A mixed methods approach involves integrating methodologies, traditionally quantitative and qualitative, but arts-based methods can also be integrated with quantitative and qualitative.
The benefit of mixing methods is that it can help you overcome the limitations and weaknesses that arise when each method is used alone and allow you to ask a broader set of questions. If different data sources reveal the same findings, or findings that at coherent with each other, this can lend credibility to your evaluation. A mixed method evaluation can also deepen understanding of your program, its effects, and context.
How to use Mixed Methods in Analysis
  • What stage of the evaluation to mix methods? (The design is considered much stronger if mixed methods are integrated into several or all stages of the evaluation.)
  • Will methods be used:
    • sequentially (the data from one source inform the collection of data from another source), or
    • concurrently (triangulation is used to integrate information from different independent sources)
  • Will qualitative and quantitative methods will be given relatively equal weighting?
Triangulating
Ensuring that your evaluation is comprehensive and holistic may involve a range of approaches. Triangulation involves transforming data from multiple sources into a logical and manageable structure that attempts to address the evaluation agenda. Utilizing multiple data collection methods leads to reliability and validity when the data from the various sources are comparable and consistent.
Drawing Conclusions
Once you have analysed and feel that you have a good grasp of your data, you can work towards drawing appropriate conclusions. You can assess the results of your analysis by comparing findings with the objectives and expectations you set out in the planning phase of your evaluation.
Answers will not always be clear cut. Your analysis may provide you with the basis for describing what happened, but there may be multiple possible explanations for observed effects. It is important to consider the interrelationships between social, economic and environmental factors. In some cases, you may need to seek clarification through further analysis and research.
Some questions to consider when drawing conclusions:
  • What are the main results or conclusions that can be drawn?
  • What other interpretations could there be?
  • Do conclusions make sense?
  • Did the results differ from initial expectations? If so, how?
End of Module: Data Analysis
Would you like to return
to the main menu?

Return to
Main Menu
Monitor progress
Your program theory and “logic model” will guide what you should be monitoring.
Monitoring should be done regularly from the start of the project. If there hasn't been regular monitoring since the start, try to do it retrospectively.
At the very least, you can ask for regular reports from the staff in the program regarding attendance, who are the people coming, who has dropped out, and any observations they have regarding how smoothly the process is going.
If you are not attending the sessions regularly, you may want to at least visit from time to time to get a sense of the enthusiasm.
Staff should be encouraged to have feedback – preferably at the end of each session – orally or in arts-based form (e.g. gestures) – from participants to gauge their reaction.
Some art forms include “closing circles” in each session at which participants are encouraged to share their feelings about the session. (Written forms can also be used).
Monitoring is an ongoing activity whereas evaluation is a more formal process conducted at a certain moment in a project to improve it (a “formative” evaluation), or at the end of a project (“summative evaluation”) – see evaluation.
Plan, Do, Check, Act
Diagram by Karn G. Bulsuk (http://www.bulsuk.com), distributed under a CC BY 3.0 license.
Arts-Based Information Gathering
Your art form will generally determine how you gather your information.
Arts-Based Gathering
Qualitative Information Gathering
Arts-Based Gathering
Context
It is vital to consider the contexts – social, cultural, political, historical, artistic – of the peoples and environment in which you are conducting research/evaluation.
Within the contexts, power dynamics can arise during the research/evaluation. Both real and perceived positions of power - among the participants, between participants and researchers/evaluators, and among researchers/evaluators - can manifest and influence the research/evaluation process.
Power dynamics can be complex and evolving, particularly in the case of shared authority where there can be uncertainty and fluidity, so it is important to be continuously and consciously aware both in terms of “official” power structures defined by governance matters and in the day-to-day interactions of those involved throughout the process. Questions to reflect on include: How do power dynamics play out in the interactions with participants? Do participants have the space and agency to share and contribute?
Context
Social & Cultural Contexts
The iceberg analogy is frequently used to illustrate the conscious and subconscious parts of a culture – the relatively smaller, visible tip of the iceberg comprises the tangible components of culture that we can easily see and define (e.g., food, dress, language, etc.) whereas the much bigger, submerged part of the iceberg comprises the “invisible” components of culture (e.g., beliefs, values, attitudes, assumptions, etc.). When conducting research/evaluation, it is imperative to be aware of, sensitive and responsive to the invisible components of a culture, and how they can emerge during the research/evaluation process.
Buen Vivir
As an example, Buen Vivir is a concept in Latin America that encompasses a broad notion of collective well being, rooted in community and intrinsically integrated with nature. Although the words literally translate from Spanish to English as “good living”, the term embodies a philosophy with interpretations and practices in cultural, historical and ecological settings. Such an underlying philosophy may influence how participants conceptualize health and well being in relation to the research/evaluation subject.
Reference:
Gudynas, E. (2011). Buen vivir: Today's tomorrow. Development, 54(4), 441-447.
Context
Historical & Political Context
The community and location where the project is taking place will have their own historical and political context that may play out in the course of the research/evaluation, either directly or indirectly.
In addition, the art form itself may have a particular historical and/or political context. For example, parkour was developed in the late 1980s by Davide Belle, the son of French working-class parents, and Sebastian Foucan, the son of Guadeloupian migrants, in response to a lack of recreational activities available to young people in their town outside of Paris. Parkour practitioners move through spaces such as urban environments using only their body, by running, climbing, jumping, rolling, and any other movements required to navigate the obstacles and space. It is both a physical and mental practice, and its philosophy encompasses ideas of self-determination, freedom, expression, and interaction with the urban environment.
Reference
De Martini Ugolotti, N., & Moyer, E. (2016). 'If I climb a wall of ten meters': Capoeira, parkour and the politics of public space among (post)migrant youth in Turin, Italy. Patterns of Prejudice, 50(2), 188-206.
Context
Indigenous Approaches
The four Rs provide a framework for which to consider research/evaluation with Indigenous peoples (adapted from Kirkness & Barnhardt, 1991; as outlined in Linds, W. et al., 2015):
  • Respect (for each other and the space we work in)
  • Relevance (to our lives)
  • Reciprocity (exchange of information and skills)
  • Responsibility (to ourselves, to each other, and to the communities we come from)
It is important to recognize and value different ways of knowing, being and seeing. This includes cultural contexts of learning and sharing knowledge.
For research/evaluation, this means integrating cultural sensitivity and a participatory approach throughout the process, as well as ensuring the research/evaluation and outputs are useful in the cultural context.
This page is a brief note on Indigenous approaches and is intended to invite further thought, research and discussion. It is not intended to be a comprehensive guide.
Reference
Kirkness, V. J., & Barnhardt, R. (1991). First Nations and higher education: The four R’s—Respect, relevance, reciprocity, responsibility. Journal of American Indian Education, 30(3), 1–15.
Linds, W. et al. (2015). Sharing the Talking Stones: Theatre of the Oppressed Workshops as Collaborative Arts-based Health Research with Indigenous Youth. In Sinner, A. & Conrad, D. (Ed.), Creating together: participatory, community-based, and collaborative arts practices and scholarship across Canada (pp. 28-45). Waterloo, Ontario: Wilfrid Laurier University Press.
National Collaborating Centre for Aboriginal Health. (2013). Indigenous Approaches to Program Evaluation.
Context
Positionality
"Positionality is the practice of a researcher delineating his or her own position in relation to the study, with the implication that this position may influence aspect of the study, such as the data collected or the way in which it is interpreted."
Reference
Dongxiao Qin of Western New England University, USA on positionality.
Influence
Ethical Issues
Whether one is doing an in-depth research study or a small operational evaluation, it is good to be aware of the ethics involved with the interactions between the researcher/evaluator and the community; as well as some special considerations when artists are involved; and if there is a “team” conducting the work, additional considerations for intra-team relations are warranted.
While only formal “research” studies are submitted to a Research Ethics Board for review (a requirement for published in a peer-reviewed academic journal), it is useful to consider ethical issues even in process evaluations.
(Content on ethics adapted from Yassi, A., et al. (2013). The Ethics of Ethics Reviews in Global Health Research: Case Studies Applying a New Paradigm. Journal of Academic Ethics, 11(2), pp. 83–101.)
Evaluations can be important tools for improving an ASC project, but they could also be weapons used against the organizers or even individual staff members in the project; or, they could be white elephants consuming resources without having much utility.
Preventing public funds from being misused on an ASC project that was ill-conceived and serving no useful purpose may make an evaluation a laudable undertaking. However, the ethics of involving staff and participants in an exercise that may be a waste of their time, or worse, do them harm, is questionable at best.
We have grouped ethical issues into three categories related to:
Ethical Issues
Ethical Issues related to Community-University Partnering
Working with diverse disciplines, norms and practices can create breakdowns in communications or misunderstandings. Power dynamics can also play an ethical role in these relationships where community groups partner with university researchers.
We have identified three issues for teams to be aware of when embarking on new community-university partnerships:
Community-university partnering
Inclusion of arts-based research
Team Issues
Research team
Ethics of Meaningful Participation
Community partners in organizations with limited funding, as well as independent artists engaged with academics in collaborative research or evaluation, have to volunteer their time to participate in the research, while those hired for the research, or leading the research based at universities are funded for their participation. This situation creates a power imbalance in ability to participate in a research partnership.
Research or evaluation teams need to be sensitive to this economic imbalance and seek creative solutions that do not violate funding rules.
Meaningful Participation
Ethics of Consent

There are constraints as to who can easily provide consent, for example:

  • Only those over 18
  • People with enough literacy and time to read detailed text-heavy materials imposed by Research Ethics Boards (REBs)
  • People who are not concerned about signing documents for other reasons such as illegal presence in the country

These constraints can result in excluding important components of the populations, if taken too literally.

Conversely individuals declining consent is important to document as well, analyzing why this refusal is occurring.

Consent needs to be made context-sensitive and flexible to avoid excluding the voices of marginalized populations while respecting the rights of individuals and communities to refrain from engaging in the research process or evaluation.

Consent
Ethics of Raising False Expectations
Community partners often expect faster turn-around times in output production than research or evaluation allows. It is essential that the community partners understand the time-frame to output production as well as limits of the research to avoid false expectations.
Good communication is essential at the outset to ensure clear and mutual understanding of:
  • The time-frame
  • Limitations of the study
  • What questions would be answered
  • What, if any, the likely impact of the research or evaluation will be
Raising False Expectations
Ethics of Stifling Creativity in Participatory Action Research: Protocol Rigidly Hampering Artistic Process
Sometimes unanticipated opportunities arise that are desirable to pursue, for example:
  • Film an artistic process (with consent of participants)
  • Conduct informal interviews at an arts show training session or other community event
Strictly speaking, if ethics approval has not been obtained in advance, this is not supposed to be done – but would constitute an unfortunate lost opportunity to improve the quality of the research.
Guidelines for ethical practices are essential but these should leave room for flexibility to accommodate the unpredictable nature of ASC research or evaluation that may present important opportunities.
Stifling Creativity
Ethics of Authorship and Ownership of Arts-Based Intervention Products
Creative collaboration leading to the generation of art raises questions relating to:
  • Authorship and ownership of the work
  • Consent to use the work
  • The truthfulness or adequacy of the work as a representation of participants’ experiences
To mitigate these issues, you may want to create written agreements about ownership within the research or evaluation team and with participants that reflect the needs and sensibilities of all. This could include flexibility to reflect and adapt as conditions require.
Authorship
Right of Acknowledgement versus Protection of Anonymity
In ASC projects, the goal is often to push participants beyond their typical comfort zones and expose them to varied perspectives and experiences in a meaningful manner. There arise ethical challenges associated with the danger of encountering difficult, emotionally charged, risky and traumatic issues, as well as “undoing” participants’ previous conceptions.
If your research or evaluation is exploring emotionally-charged topics, it is important to be trained to deal with potential problems and have informed support available for everyone involved including the artists and researchers or evaluators.
Moreover, be cognizant that your own values will inevitably influence the process and be careful to avoid imposing dominant values.
Right of Acknowledgement
Ethics of Dangerous Emotional Terrain
There is a tension between the goal of anonymity and protecting vulnerable participants on one side, and the desired goal of stigma reduction strategies that promote speaking out.
Further, participants sometimes want their identity to be known, as they are proud of their contribution and want their insights offered to the researchers or evaluators to be openly attributable to them.
If future consequences are properly explained in a manner that is understood by participants, they should be allowed to determine whether or not they want to be identified and should have the right to change their position during the research or evaluation period.
Dangerous Emotional Terrain
Ethics of Representation
Misrepresentation of art can easily happen, and there are ethical implications of divergent interpretations.
Good practices to mitigate this potential issue are:
  • Take preliminary “results” back to artist participants for feedback
  • Establish a monitor for the group during the interpretation process
Representation
Ethics of Caring for Team Members, Students and Staff
Ethics of team relations – and valuing all team members through taking care of their material and emotional needs - is part of the imperative of the research or evaluation.
Always keep the wellbeing of all team members, and team dynamics in the forefront, being willing to challenge institutional norms if necessary.
Caring for Team Members
Ethics of Researcher Engagement and Commitment
Different researchers or evaluators shoulder different responsibilities and contribute different levels of commitment, and time.
Sometimes these are known from the start; sometimes work or family commitments outside the project impact on originally envisioned commitments; this creates dilemmas for other team members and partners.
To help avoid these dilemnas:
  • Make time commitments transparent to all at the beginning
  • Review time commitments periodically
  • Plan regular “check-ins” to take unforeseen circumstances into account
Researcher Engagement
Ethics of Expanding the Team After the Project is in Process
Research and evaluation is increasingly becoming a collective endeavor, and often researchers/evaluators and artists seek to co-research/-evaluate and co-create with colleagues, friends, and those with whom there is a shared recognition of theoretical resonance, expertise, perspective and previous lived experience, sometimes only discovering this resonance after the project has started.
To avoid potential issues that may arise with expanding the team:
  • Articulate at the beginning of the process clearly stated criteria for inviting colleagues and partners
  • When bringing in new expertise, undertake dialogue with original team members to ensure that the new recruit will not undermine the complex research dynamics in any way
Expanding the Team
Ethics of Interdisciplinarity – Different Cultures of Publication, Collaboration, and Notions of Ethical Research
There are very different cultures in different disciplines, such that what is unethical in one discipline might be the norm in another – with respect to norms in:
  • Publishing
  • Extending invitation to co-author
  • How collaboration is conducted
  • What constitutes ethical research practice
To work effectively across disciplines:
  • Openly discuss the varied needs and expectations with respect to:
    • Authorship
    • Collaboration
    • Implications of one approach to research or evaluation on the integrity for another
  • Engage in considerable dialogue and reflection at all stages of the research, particularly in mixed methods studies attempting to embody multiple approaches
Interdisciplinarity
Theory of social change and its relevance to choice of methods
There is much debate about what constitutes social change – or what are the pathways to equity-sensitive social transformation.
The theory of social change should determine the design of the evaluation – including the questions asked and the interpretation of the findings – but it does not restrict the methods that can be used. Although the focus of each of the evaluations is different, any of the methods (i.e. quantitative, qualitative or arts-based) can be used as data gathering techniques (e.g., analysis of secondary data, surveys, interviews, observation, document review, etc.).
For example, the theory of how a program results in social change could be, by:
  1. Helping participants feel empowered in their daily lives; or
  2. Strengthening participants’ ability to humanize their social reality but not fundamentally challenge the logic of social relations; or
  3. Building awareness and skills in participants to revolutionize the social system to make it more equitable.
Based on the theory of change for each of the examples above, the focus of the evaluation would be:
  1. Personal empowerment, e.g., asking participants about their personal empowerment before and after the program
  2. Social engagement, e.g., documenting participants’ changes in social engagement
  3. Hierarchical relations and social activism, e.g., observing changes in hierarchical relations within the group and examining the nature of social activism
The above A, B, C designation can be seen simply as relating to social change at the micro (individual) level; meso (group level), or macro (societal level).
Examples of outcomes at the micro (individual) level include:
  • Personal empowerment
  • Self-confidence
  • Reframing of identity
Examples of outcomes at the meso (group) level include:
  • Fortified social support
  • Increased social inclusion
Examples of outcomes at the macro (societal) level include:
  • Policy change (e.g., through "legislative theatre")
  • Social media movements (e.g., #MeToo)
  • Electoral outcomes (e.g., election results, voter turnout)
  • Participation in civil disobedience protests
However, as theorist Dr. Jennifer Spiegel points out - these are not mutually exclusive categories. She writes:
“Shows may critique a social system - or not - but what is learned, finally, is a way of relating, creating and adapting to structures of production itself. Here the act of expression is what matters rather than that which is said - how it is put together rather than what is put together… Personal and interpersonal transformations, particularly at the level of sensibilities and modes of relating…could lead to broader social transformation; and conversely, social and political transformations could shape subjectivity at both the individual and collective level.”
Is social change the same as social transformation?
In discussing theories of social change, Dr. Jennifer Spiegel writes:
“It is important to recognize that process-based theories of change do not require attaining utopian equality as a condition of success. Transformation is a process, not a destination.”
But she also cautions:
“The need for an NGO to sustain a program’s funding [could] undercut its ability to bring about long-standing and far-reaching social transformation. For the extra step toward not only collective “expression” but also collective social transformation, the process itself may require not only the shared unpacking of collective expression and its relation to personal goals, but also shared development of pathways forward.”
Transformative Paradigm
The third example above (“Building awareness and skills in participants to revolutionize the social system to make it more equitable”) would be a transformative paradigm of social change as it encompasses systemic and collective levels of change.
A transformative paradigm (or way of thinking) examines issues of social justice and marginalization. Transformative paradigms are often associated with language such as: critical theory, neo-Marxist, feminist, critical race theory, Freirean, participatory, emancipatory, advocacy, grand narrative, interventionist, queer theory, race specific and counter-hegemonic, among others.
Simply put, adopting a transformative paradigm means making social justice a central objective of the program and its evaluation; but just like the different theories of social change, it does not restrict the evaluation techniques employed – all methodologies of data gathering (quantitative, qualitative, arts-based) could have a place.
But context matters!